Document your Excel®1 documents landscape
Find the source of the data used in your Excel® formulas

EUDYS® REF allows you to:
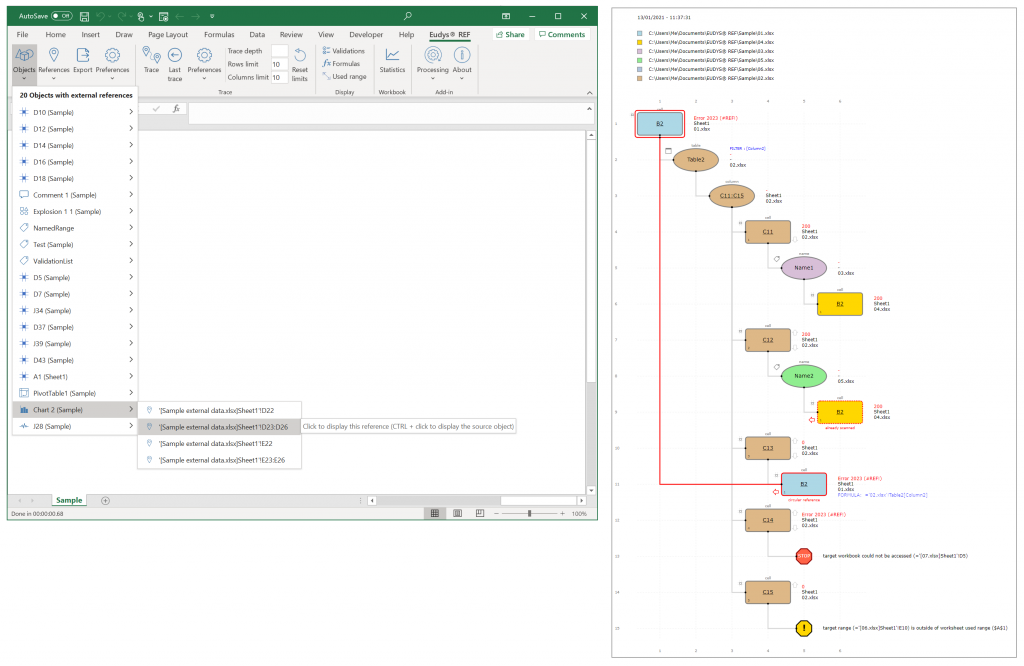
- List and locate all your Excel®1 documents external references (references to other Excel® documents)
- Trace sources of the internal and external data reference used in cells formulas, names, tables, pivot tables, charts, sparklines and validations.
- Process thousands of references in a matter of minutes2
- Detect circular references across multiple documents
- Display graphically the trace results in any internet browser supporting Scalable Vector Graphics (Edge®1, Chrome®3, Firefox®4, …)
- Display traced data formulas and values
- Easily navigate through the trace results (mouse and keyboard)
- Easily access the referenced documents with a single click
Trace samples5
Use mouse clicks (click and ctrl+click on arrow icons) and keyboard keys (arrows, home, end, back) to navigate throughout the trace results. Hover the mouse cursor over trace nodes to display formulas. Note that your internet browser must support Scalable Vector Graphics (SVG) to display EUDYS® REF trace results, most modern browsers do. Also note that SVG performance varies drastically from one browser to the other.
- Sample 1 : circular reference
- Sample 2 : a very long trace (1700+ nodes)
- Sample 3 : from a Chart
- Sample 4 : from a Pivot Table
- Sample 5 : from a Sparkline
- Sample 6 : from a Data Validation
- Sample 7 : from a cell in a Table (ListObject)
You have questions or are interested by a demonstration?
- Contact us contact@eudys.com
1 Microsoft®, Excel® and Edge® are registered trademarks of the Microsoft Corporation.
2 Actual performance depends on the number, length and complexity of the Excel® formulas being parsed and on the used computer characteristics. A non-binding and indicative average number is 1000 references per minute.
3 Chrome® is a registered trademarks of the Google Limited Liability Company.
4 Firefox® is a registered trademarks of the Mozilla Foundation.
5 Your internet browser must support Scalable Vector Graphics to visualize samples.